Boulevard of Dreams
‘Boulevard of Dreams’ was a concept to display future developments along Washington Boulevard in Stamford, CT.
‘
DISTRACTED DRIVING
Distracted driving has been a top issue all over the country so I wanted to create a vector illustration of winding roads with distractions, that displayed the data for the infraction. This graphic was picked up by other sister papers throughout the country and it ran in other publications with my credit.

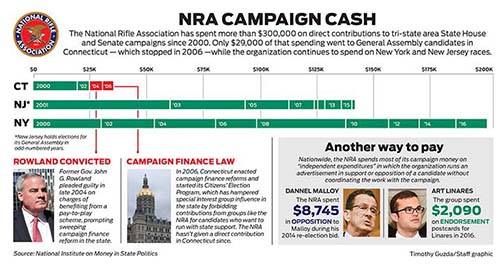
NRA CASH
‘NRA Campaign Cash’ was among the most challenging graphics I had to assemble. A massive data set that had to convey YEARS, $ AMOUNT, 3 STATES, TIMELINE and BREAKOUTS to explain the Campaign Finance Law enacted in Connecticut against Special Interest Groups such as the NRA. This massive web had to be untangled and simplified so our readers could digest multiple angles of information. It took at least a dozen sketches to commit to the composition I felt would be our best chance of checking all the boxes. It would end up being a horizontal format, with three stacked bars that would be color coded, above breakouts that followed a passage of time… yes… tall order! The final result was extremely gratifying because many in our group had their doubts it could be pulled off. I enjoy proving people wrong.
BOARD OF EDUCATION
Election time in the news industry is the most challenging time, and it was my job to effectively communicate with our readers with clean graphics. The Board of Education had 5 open seats and the balance of power was at stake. To create an engaging way for readers to understand the candidates, where they sit, and their party affiliations, I created a schematic of the actual desk they sit at during hearings. Yes, that’s the actual shape of the desk! After this graphic ran, I was delighted to hear how many people kept this page for keepsakes so they can use it as a visual reference for years to come.

POVERTY RATES
Bar graph, tables, and percentage breakouts.

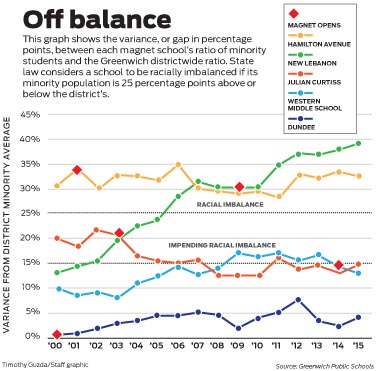
Off balance
Fever-line graphic using color codes.
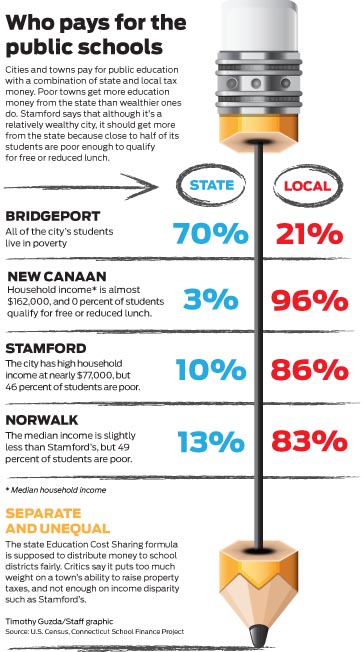
Public school funding
Photo illustration using percentage breakouts.
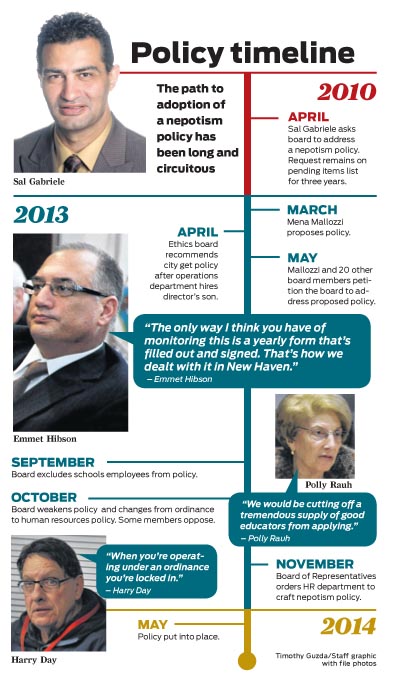
Nepotism
Timeline graphic showing Stamford’s, CT nepotism policy.
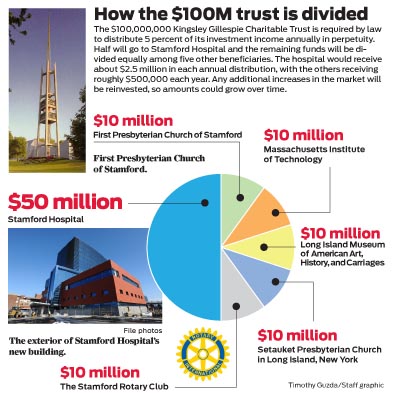
Divided trust
Pie chart showing who gets portions of a $100M trust.
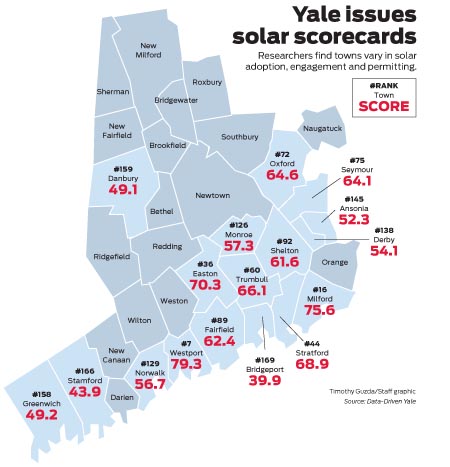
Locator map with data
Scorecard showing which towns engaging in solar adoption.